Models of brown dwarf atmospheres suggest they exhibit complex physical behaviour. Observations have shown that they are indeed dynamic, displaying small photometric variations over timescales of hours. Here I report results of infrared (0.95-1.64 micron) spectrophotometric monitoring of four field L and T dwarfs spanning timescales of 0.1-5.5 hrs, the goal being to learn more about the physical nature of this variability. Spectra are analysed differentially with respect to a simultaneously observed reference source in order to remove Earth-atmospheric variations. The variability amplitude detected is typically 2-10%, depending on the source and wavelength. I analyse the data for correlated variations between spectral indices. This approach is more robust than single band or chisq analyses, because it does not assume an amplitude for the (often uncertain) noise level (although the significance test still assumes a shape for the noise power spectrum). Three of the four targets show significant evidence for correlated variability. Some of this can be associated with specific features including Fe, FeH, VO and KI, and there is good evidence for intrinsic variability in water and possibly also methan. Yet some of this variability covers a broader spectral range which would be consistent with dust opacity variations. The underlying common cause is plausibly localized temperature or composition fluctuations caused by convection. Looking at the high signal-to-noise ratio stacked spectra we see many previously identified spectral features of L and T dwarfs, such as KI, NaI, FeH, water and methane. In particular we may have detected methane absorption at 1.3-1.4 micron in the L5 dwarf SDSS 0539-0059.
Monthly Notices of the Royal Astronomical Society, 348, 1145-1157 (2008)
[PDF version] 14 pages
[two page summary]
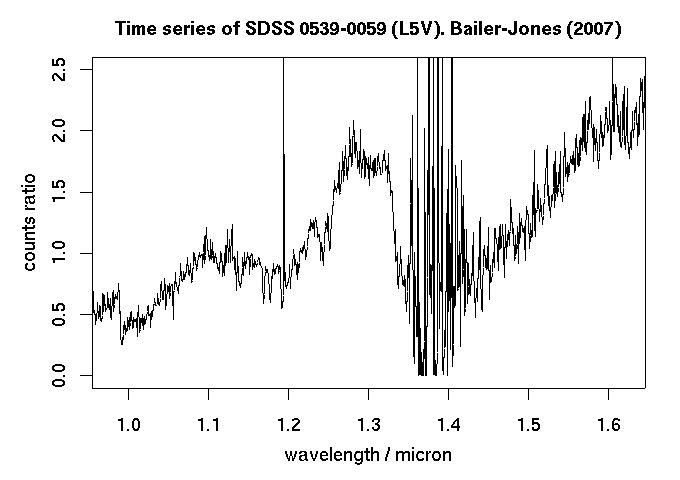
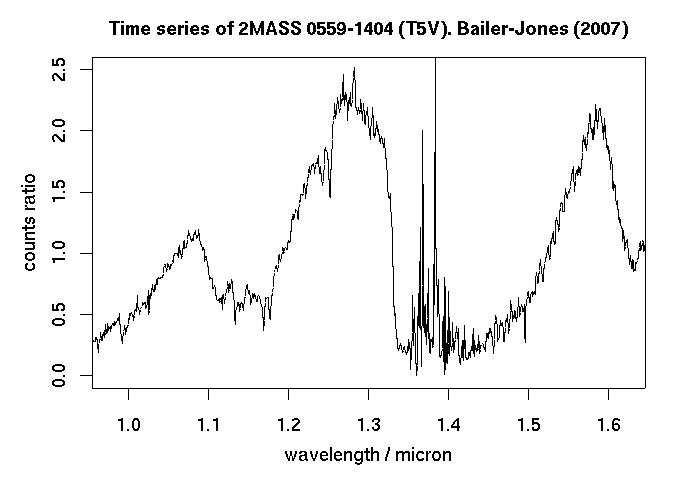
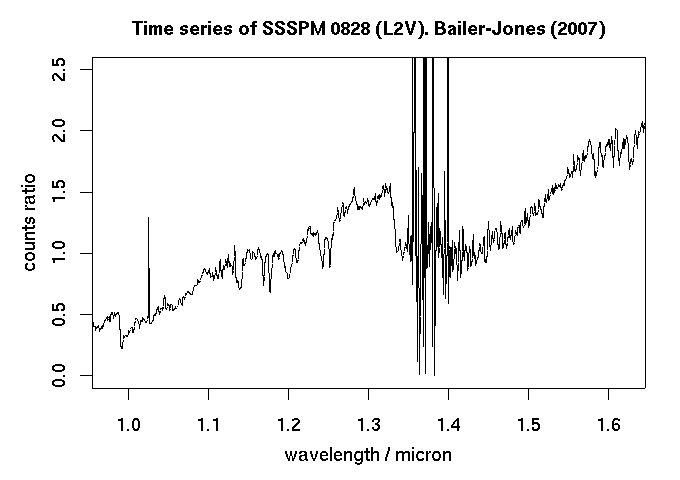
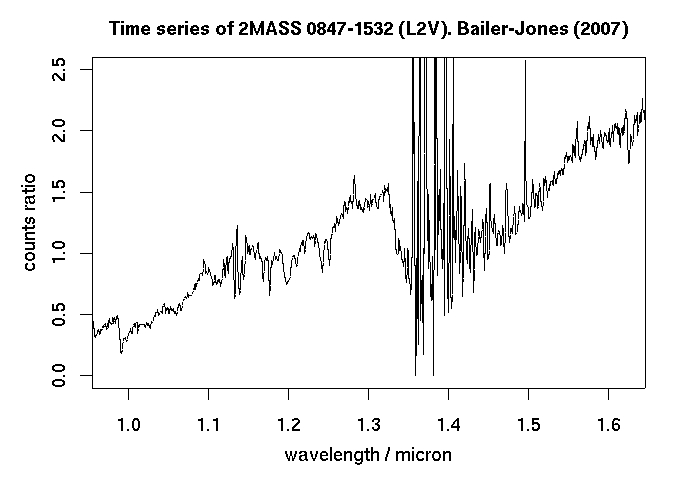
In the following movies, the ordinate is proportional to the photon
counts and the spectra are shown at the full recorded wavelength
resolution. The time span varies between 2.25 and 2.5 hours (see Table
2 of the article). The data are the rectified, paired, relative
spectra (see section 2.4).
Movie of spectral time series of SDSS 0539-0059
Movie of spectral time series of 2MASS 0559-1404
Movie of spectral time series of SSSPM 0828
Movie of spectral time series of 2MASS 0847-1532